What a Useful Weekly Website Growth Report Should Say
A useful weekly growth report should explain what changed, which pages and sources created leads, which fixes shipped, and what should happen next. Use this structure when reporting needs to produce decisions instead of vanity summaries.
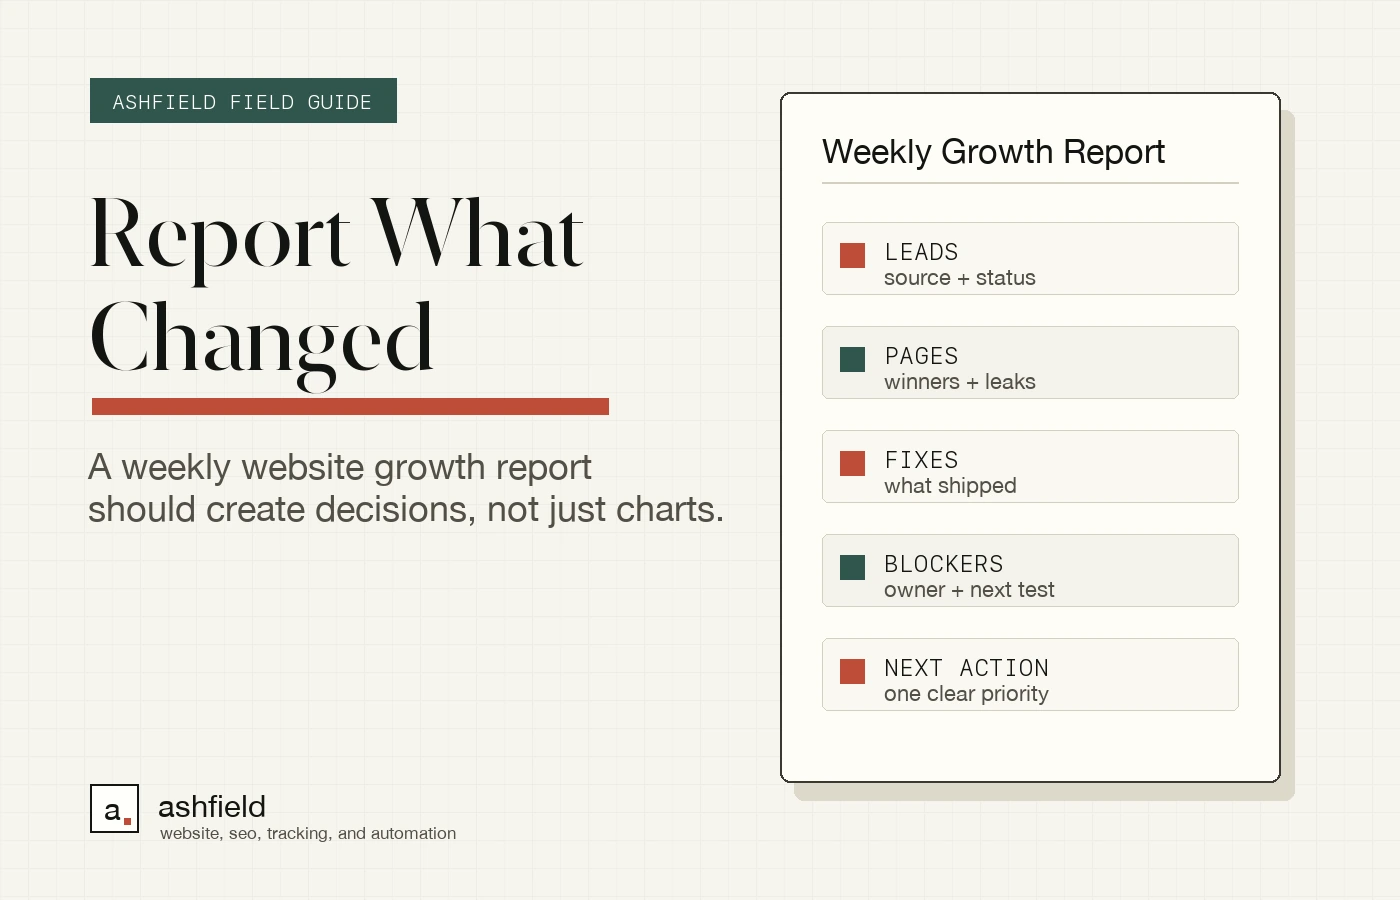
Most weekly website reports are too busy to be useful.
They show traffic, rankings, impressions, clicks, conversions, charts, and screenshots. Then everyone leaves the meeting with the same unanswered questions: what changed, did it matter, what shipped, what is blocked, and what should we do next?
A useful growth report has a different job. It turns the week into decisions.
That does not mean hiding the data. It means organizing Search Console, GA4, form, call, CRM, and implementation notes around the work an owner or marketing lead can actually approve. The report should be short enough to read, clear enough to trust, and specific enough to assign work from.
Start With The Decision The Report Should Create
Before choosing metrics, write the decision the report needs to support.
For many owner-led and agency-led sites, the weekly decision is one of these:
- Which page should we improve next?
- Which leads are worth following up on?
- Which channel or campaign needs better source tracking?
- Which technical fix should be shipped before more content is produced?
- Which service, location, or offer deserves more budget?
- Which report section can be removed because nobody acts on it?
That decision should appear near the top of the report, before the tool screenshots.
A simple opening works:
| Weekly question | Useful report answer |
| --- | --- |
| What changed? | Organic clicks were flat, but service-page form starts increased after the CTA repair. |
| Why does it matter? | The lead path is improving on one high-intent page, while two older pages still lose source context. |
| What shipped? | Updated the form hidden fields, compressed the service-page hero image, and fixed one broken internal link. |
| What is blocked? | Call tracking still does not pass landing-page context into the CRM. |
| What happens next? | Test the call path, then update the next two service pages with the same form configuration. |
This is the difference between reporting and exporting. A tool export says what a platform recorded. A growth report says what the business should do with it.
Use A Short Scoreboard, Then Explain The Movement
The first data section should be a scoreboard, not a dashboard clone.
For a weekly reporting rhythm, useful scoreboard rows often include:
- Organic clicks and impressions from Search Console.
- Top pages by qualified leads, form starts, calls, or booked appointments.
- Leads by source, medium, campaign, and landing page when those fields are available.
- Form submissions by form name and page.
- Call or booking actions by page when tracking is configured.
- New, updated, or fixed pages.
- Technical fixes shipped.
- Blockers that need owner, developer, CRM, or ad-platform attention.
Search Console defines clicks, impressions, CTR, and position inside its performance reporting, but those numbers still need interpretation. More impressions can mean better visibility, broader queries, a seasonal shift, or a page appearing for less-relevant searches. Fewer clicks can be a problem, or it can be normal if a campaign ended or the query mix changed.
Do not make the owner interpret that alone. Add one plain-language note under the scoreboard:
"Search visibility increased on the reporting automation page, but leads did not move because the page still routes visitors to a generic contact form. Fix the CTA and source fields before writing another reporting article."
That sentence is more useful than five charts with no decision attached.
Report Leads With Source Context, Not Just Totals
"We got 14 leads" is not enough.
The report should show which leads can be tied back to pages, sources, campaigns, forms, and follow-up status. It should also show when the tracking is incomplete.
Use fields like:
| Field | What it tells you |
| --- | --- |
| Landing page | Which page created the action path. |
| Form name | Which offer or contact path the visitor used. |
| UTM source | The tagged source when a campaign link was used. |
| UTM medium | The channel type, such as email, paid, referral, organic, or social. |
| UTM campaign | The specific campaign label, when available. |
| Referrer | The previous page or domain when the browser passes it. |
| GA4 channel | The grouped traffic category GA4 assigned. |
| CRM status | Whether the lead became qualified, booked, unqualified, or unresolved. |
| Follow-up owner | Who needs to act next. |
GA4's default channel groups can help classify traffic into broader source categories, but a weekly report should not stop there. Channel labels are useful for scanning. They are not a replacement for preserving the page, form, campaign, and CRM context that makes a lead actionable.
A practical lead note might say:
"Three form submissions came from organic search to the technical SEO services page. Two preserved landing-page and form-name fields. One arrived without source context because the embedded form dropped hidden fields on mobile."
That is the kind of reporting that creates implementation work. It tells the team where growth is happening and where measurement is breaking.
Separate What Changed From What Shipped
Many reports blur performance movement and implementation work together. Keep them separate.
"What changed" is about observed movement:
- Search Console clicks, impressions, CTR, and query movement.
- GA4 sessions, engaged sessions, key events, and channel movement.
- Form submissions, calls, bookings, or consultation requests.
- Landing pages that improved or declined.
- Query families gaining or losing visibility.
- Lead quality changes in the CRM.
"What shipped" is about work completed:
- Updated title tags or descriptions.
- Fixed internal links.
- Added service-page copy.
- Repaired a form.
- Added hidden fields.
- Updated schema that matches visible page content.
- Improved page speed issues.
- Published or refreshed a page.
- Corrected tracking tags.
This split protects the team from false credit. A lead spike on Monday may not have been caused by a fix shipped on Friday. A technical repair may be necessary even if traffic does not move for two weeks. A report should show both without pretending every movement has a neat cause.
A good shipped-fix row includes:
| Fix | Page | Why it mattered | How to verify |
| --- | --- | --- | --- |
| Added hidden source fields | Contact form | Preserves landing page and campaign context. | Submit test lead from a tagged URL and check CRM fields. |
| Fixed broken service link | Homepage | Restores path to high-intent service page. | Crawl page or click mobile navigation. |
| Compressed hero image | Reporting page | Reduces load friction before form CTA. | Retest page and confirm image still renders cleanly. |
| Added FAQ section | Service page | Answers buyer follow-up questions on the page. | Check visible copy and structured-data match. |
The report becomes a work ledger, not a trophy wall.
Include A Blockers Section People Can Act On
Blocked work should not be buried in a paragraph.
Use a short blockers table:
| Blocker | Owner | Why it matters | Next action |
| --- | --- | --- | --- |
| CRM does not store landing page | CRM/admin | Leads cannot be tied back to pages. | Add fields and map form values. |
| Form trigger fails on AJAX submit | Developer | GTM does not see every submission. | Test GTM preview and add a reliable event. |
| Call tracking lacks source context | Marketing ops | Phone leads are counted but not attributed. | Confirm dynamic number or call source setup. |
| Service page has no proof | Business owner | Visitors see claims without evidence. | Add real projects, reviews, credentials, or process notes. |
Google Tag Manager's form submission trigger can fire when a form has been sent, but modern forms do not always behave the same way. Some forms redirect, some use AJAX, some show a success message, and some never expose a normal submit event. The report should not just say "form tracking is broken." It should name the exact path that failed and the test needed next.
That is especially important for small teams. If the report says "tracking issue," nothing happens. If it says "contact form on mobile does not pass landing page into CRM," someone can fix it.
Show What The Report Should Leave Out
Useful reporting is also editing.
Leave out anything that does not change a decision:
- Ranking screenshots with no page or query context.
- Long lists of keywords nobody plans to work on.
- Traffic charts that ignore lead quality.
- GA4 tables pasted without interpretation.
- Tool health scores that do not identify a shipped fix.
- Month-over-month percentages with tiny sample sizes.
- Unlabeled "conversion" totals that mix calls, forms, clicks, and page views.
- AI-written summaries that restate the chart without explaining the next action.
The report can still keep supporting data in an appendix, spreadsheet, or dashboard. The weekly version should carry the operational answer.
Ask this of every section:
1. Does it show what changed?
2. Does it explain why that matters?
3. Does it connect to a page, source, lead, fix, or blocker?
4. Does it name the next action?
5. Would removing it make the weekly decision worse?
If the answer to the fifth question is no, remove or demote the section.
Use A Repeatable Weekly Report Outline
Here is a practical outline that works for website, SEO, tracking, and marketing operations reporting:
| Section | What it should say |
| --- | --- |
| Executive decision | The one thing the owner should approve, fix, or inspect this week. |
| What changed | Search, traffic, lead, and page movement in plain language. |
| Lead/source context | Which pages, forms, sources, campaigns, and CRM statuses produced opportunities. |
| Shipped fixes | What was implemented and how it was verified. |
| Blockers | What prevented clean reporting or growth work. |
| Next actions | The next three tasks, each with an owner and expected result. |
| Appendix | Tool exports, screenshots, and deeper tables for anyone who wants them. |
The summary can fit on one page. The appendix can be as deep as needed. That keeps the business discussion focused while still preserving evidence.
For AI-search and search-quality purposes, this kind of report structure also makes the page more source-worthy. It defines terms, answers follow-up questions, gives original examples, and keeps visible claims aligned with evidence. Google's people-first content guidance is a useful reminder here: content should be built for people first, not to manipulate rankings. The same standard applies to internal reporting. Do not pad the report with metrics nobody uses.
Ashfield's Reporting Automation Path
Ashfield helps owner-led teams and agency partners turn scattered website data into weekly decisions.
The practical path is:
- Use `/solutions/marketing-reporting-automation` when reports take too long to assemble or do not produce clear next actions.
- Use `/solutions/conversion-tracking-lead-attribution` when forms, calls, and CRM fields need better source context.
- Use `/solutions/technical-seo-services` when the report keeps finding implementation issues that never ship.
- Use `/resources` when you want practical website, SEO, tracking, and reporting references before choosing a scope.
- Use `/contact` when the next step is a scoped reporting automation or tracking cleanup conversation.
The goal is not a larger dashboard. The goal is a weekly report that tells the truth clearly enough for someone to act.
Sources Used For This Reporting Checklist
- Google Search Console Help: What are impressions, position, and clicks?: https://support.google.com/webmasters/answer/7042828
- Google Search Console Help: Performance report overview: https://support.google.com/webmasters/answer/7576553
- Google Analytics Help: Default channel group: https://support.google.com/analytics/answer/9756891
- Google Tag Manager Help: Form submission trigger: https://support.google.com/tagmanager/answer/7679217
- Google Search Central: Creating helpful, reliable, people-first content: https://developers.google.com/search/docs/fundamentals/creating-helpful-content
FAQ
What should weekly growth reporting include?
A useful weekly report should include what changed, which pages created leads, which sources or campaigns influenced those leads, which fixes shipped, what is blocked, and what should be prioritized next. It should also define the data source for each metric so the owner knows whether the number came from Search Console, GA4, a form, a CRM, or a manual note.
How is a website growth report different from a standard SEO report?
A standard SEO report often centers rankings, traffic, clicks, and impressions. A growth report can still include those, but it connects them to business operations: forms, calls, source fields, page improvements, content updates, technical fixes, and the next decision. The goal is not just visibility. The goal is knowing what to repair, repeat, pause, or fund.
What should a report leave out?
Leave out screenshots, rankings, campaign labels, and traffic charts that do not change a decision. Avoid fake precision, unexplained percentages, disconnected vanity metrics, and long tool exports. If a number cannot answer what happened, why it matters, who owns the next step, or what needs checking, it belongs in an appendix or not in the weekly report.
How do you report leads by source without overclaiming?
Use the source fields you actually capture, such as landing page, referrer, UTM source, medium, campaign, form name, call source, and CRM status. Then label gaps clearly. A report can say a lead arrived through organic search to a service page if the data supports it. It should not claim revenue impact, channel credit, or campaign success when the tracking path is incomplete.
When should a business automate website reporting?
Automate reporting when the same weekly questions keep coming up, the data is spread across several tools, source fields get lost, or reports take so long to prepare that fixes are delayed. Automation should not create a larger dashboard. It should assemble the repeatable parts, flag exceptions, and leave room for human notes about shipped work, blocked fixes, and next actions.
Keep reading
What Fail-Closed QA Means Before a Local Post Goes Live
AI and content calendars make it cheap to ship local posts. Fail-closed QA is the opposite habit: named checks that block publish when the copy would misrepresent a shop, pad a suburb, skip the call path, or invent a fact.
What Actually Moves Calls for Multi-Location Home Services (Maps, Pages, Conversion)
If call volume is flat, more blog posts are usually the wrong first move. Inspect the Maps listing a buyer actually sees, the location or service page they land on, and the tap-to-call or form path that has to finish the job.
How Multi-Location Home Service Brands Keep City Pages Distinct
A city-page farm can look like coverage while giving buyers the same thin answer in ten URLs. Use this method to approve only the markets that differ, publish what must be distinct, and keep those pages current on a weekly cadence.